Fisheries bioeconomics integrates the biological dynamics of stocks with the economic behaviour of fishers. When effort grows too much, the stock falls and each trip catches less: more boats, hours and fuel do not guarantee more production or income.
Fisheries bioeconomics integrates the biological dynamics of stocks with the economic behaviour of fishers. When the stock is healthy, a given amount of effort can yield high catches. If boats, working hours, gear and fuel increase excessively, the stock shrinks and each additional unit of effort tends to catch less.
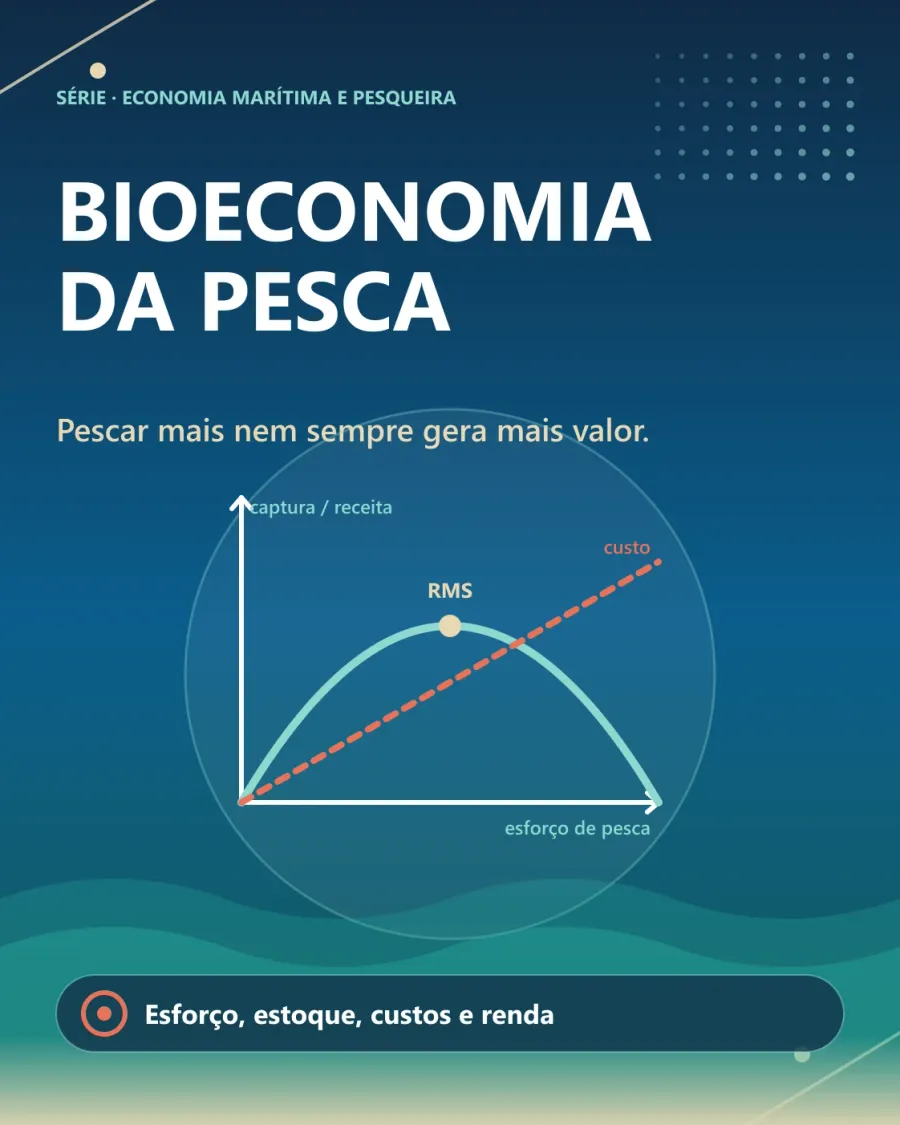
The Gordon–Schaefer model represents this relationship through a sustainable yield curve. Catch grows with effort until it reaches the maximum sustainable yield and, beyond that point, begins to fall because the stock can no longer replace itself at the same pace. The curve helps visualise why fishing more does not guarantee a permanent increase in production.
The total cost of effort is usually represented by a rising line. The difference between revenue and cost indicates the economic rent of the sector. The maximum economic yield lies to the left of the maximum sustainable yield, since it requires less effort, keeps a larger stock in the sea and produces higher net income. Under open access, however, new entrants and more effort can advance to the point where revenue and cost are equal, dissipating that rent.
Bioeconomic analysis relates stock, natural growth, effort, catch, costs, prices and access rules. It shows that biological, economic and social goals do not coincide automatically and that the choice of a management point distributes effects between present production, future conservation, employment and income.
Consequently, the largest possible catch does not necessarily correspond to the best economic or social outcome. Responsible management seeks to keep stocks productive with a level of effort capable of sustaining income, reducing waste and preserving opportunities for future generations.
Further reading
- Gordon, H. S. (1954). “The Economic Theory of a Common-Property Resource: The Fishery”. Journal of Political Economy, 62(2), 124–142. doi:10.1086/257497
- Schaefer, M. B. (1954). “Some aspects of the dynamics of populations important to the management of the commercial marine fisheries”. Bulletin of the Inter-American Tropical Tuna Commission, 1(2), 27–56.
- Clark, C. W. (2010). Mathematical Bioeconomics: The Mathematics of Conservation. 3rd ed. Hoboken: Wiley.
- Seijo, J. C.; Defeo, O.; Salas, S. (1998). Fisheries Bioeconomics: Theory, Modelling and Management. FAO Fisheries Technical Paper 368. Rome: FAO. Full text
- Anderson, L. G.; Seijo, J. C. (2010). Bioeconomics of Fisheries Management. Ames: Wiley-Blackwell.
- Grafton, R. Q. et al. (2007). “Economics of Overexploitation Revisited”. Science, 318(5856), 1601. doi:10.1126/science.1146017 — Why the economic optimum usually requires stocks larger than MSY.
Websites to explore
- FAO — FishStat: world capture and aquaculture statistics by species and country.
- RAM Legacy Stock Assessment Database: open database of fish stock assessments worldwide.
- Sea Around Us: catch reconstructions by country and exclusive economic zone.